IC Markets Home Sign in Web Trader Contáctanos
IC Markets Social IC Markets Social

Información para
Operadores Serios

  • Acerca de IC Markets
  • ABRA UNA CUENTA BURSÁTIL
  • PRUEBE UNA DEMO GRATIS
  • Comienza a Operar
  • VISIT OUR BLOG
IC Markets Social
  • Acerca de IC Markets
  • ABRA UNA CUENTA BURSÁTIL
  • PRUEBE UNA DEMO GRATIS
  • Comienza a Operar
  • VISIT OUR BLOG
August 2, 2023Australian_Stocks_enIC Markets

Hong Kong 50 Index – getting close to psychological price line

Hong Kong 50 Index is moving towards a support line. Because we have seen it retrace from this level in the past, we could see either a break through this line, or a rebound back to current levels. It has touched this line numerous times in the last 23 days and may test it again […]

Read more
August 1, 2023Australian_Stocks_enIC Markets

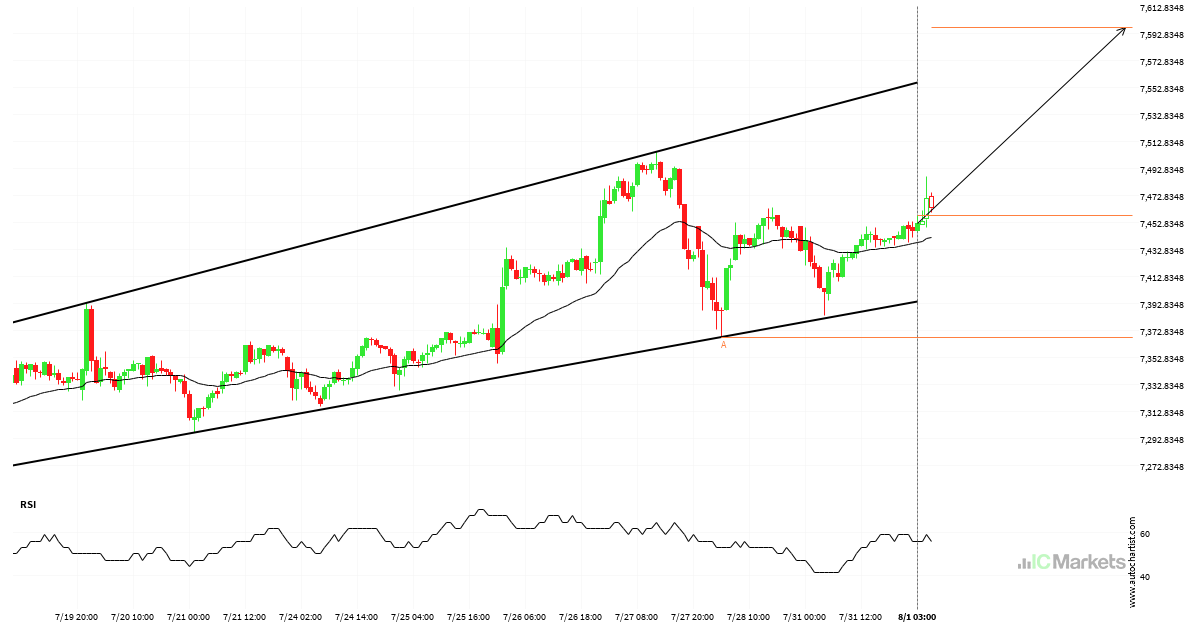
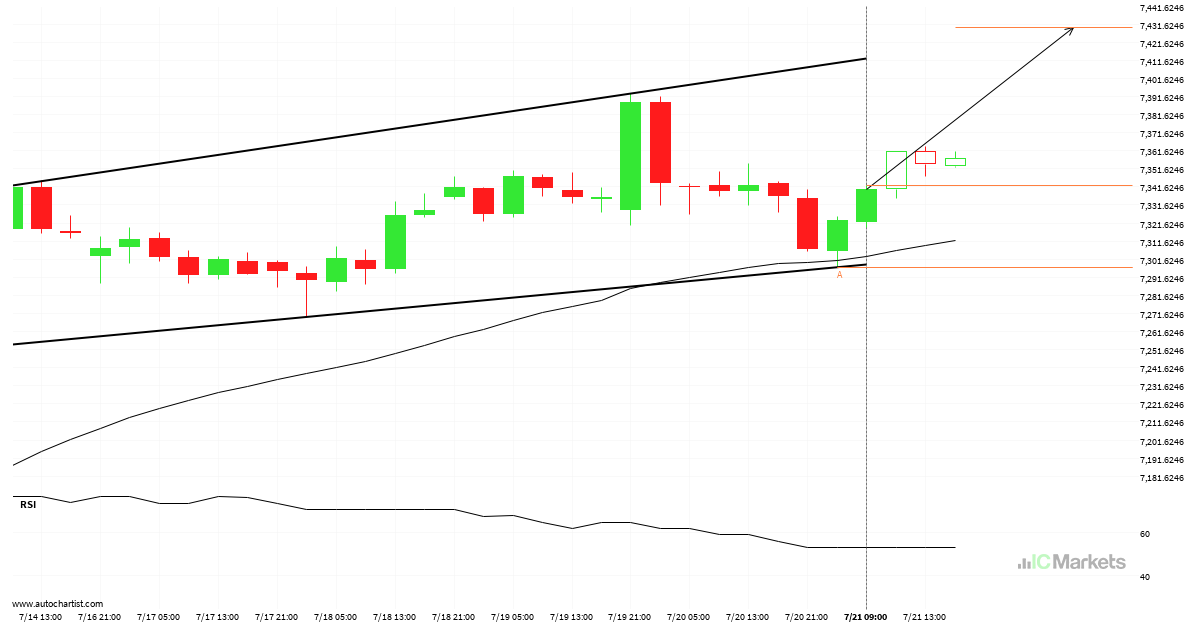
Australia 200 Index approaching resistance of a Channel Up

Australia 200 Index is approaching the resistance line of a Channel Up. It has touched this line numerous times in the last 15 days. If it tests this line again, it should do so in the next 3 days.

Read more
July 31, 2023Australian_Stocks_enIC Markets

FTSE China A50 Index – getting close to psychological price line

FTSE China A50 Index is moving towards a resistance line. Because we have seen it retrace from this level in the past, we could see either a break through this line, or a rebound back to current levels. It has touched this line numerous times in the last 4 days and may test it again […]

Read more
July 31, 2023Australian_Stocks_enIC Markets

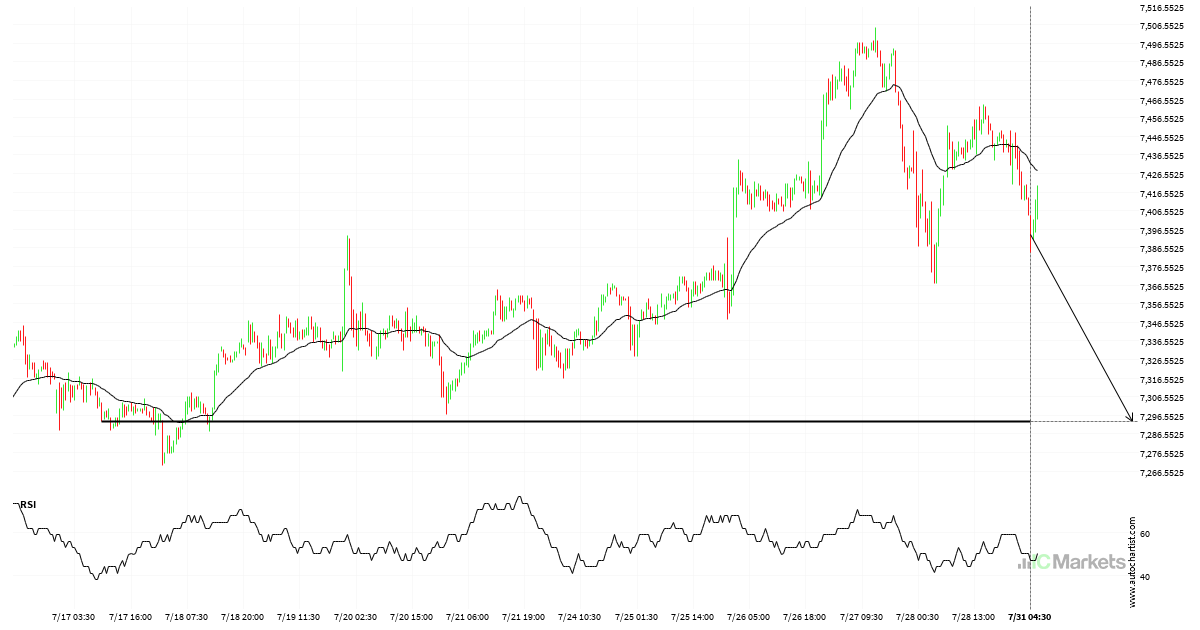
Australia 200 Index – getting close to psychological price line

Australia 200 Index is moving towards a support line. Because we have seen it retrace from this level in the past, we could see either a break through this line, or a rebound back to current levels. It has touched this line numerous times in the last 14 days and may test it again within […]

Read more
July 30, 2023Australian_Stocks_enIC Markets

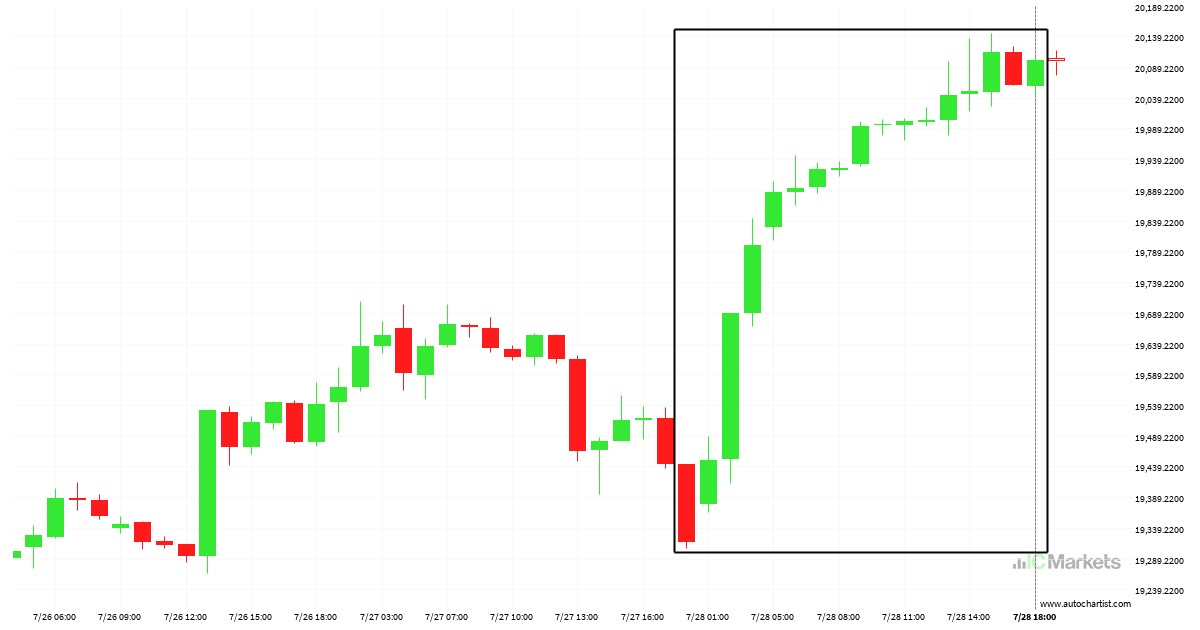
Huge bullish move on Hong Kong 50 Index

Hong Kong 50 Index has moved higher by 4.04% from 19319.2 to 20100.2 in the last 2 days.

Read more
July 25, 2023Australian_Stocks_enIC Markets

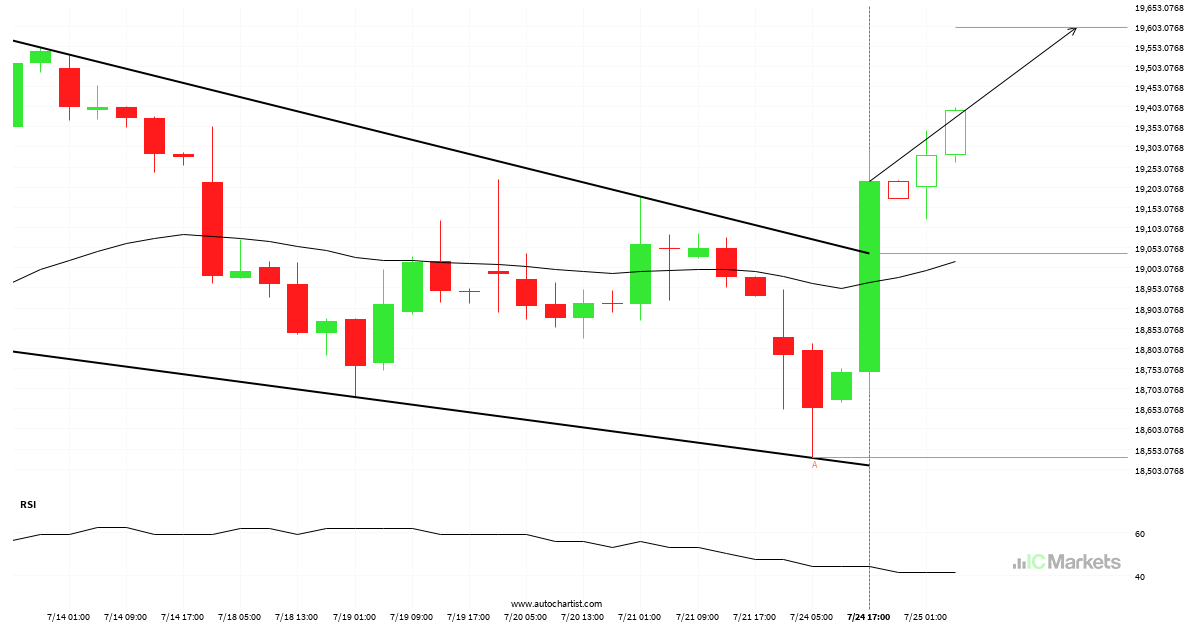
Hong Kong 50 Index has broken through resistance

Hong Kong 50 Index has broken through a resistance line. It has touched this line at least twice in the last 18 days. This breakout may indicate a potential move to 19598.7910 within the next 22 hours. Because we have seen it retrace from this position in the past, one should wait for confirmation of […]

Read more
July 24, 2023Australian_Stocks_enIC Markets

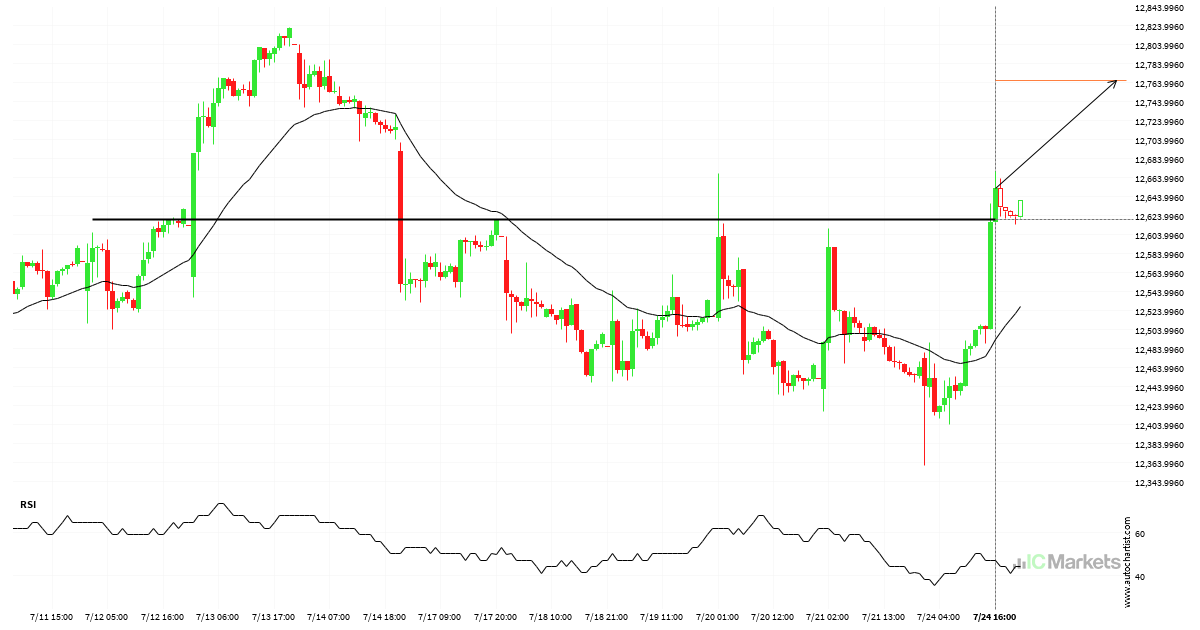
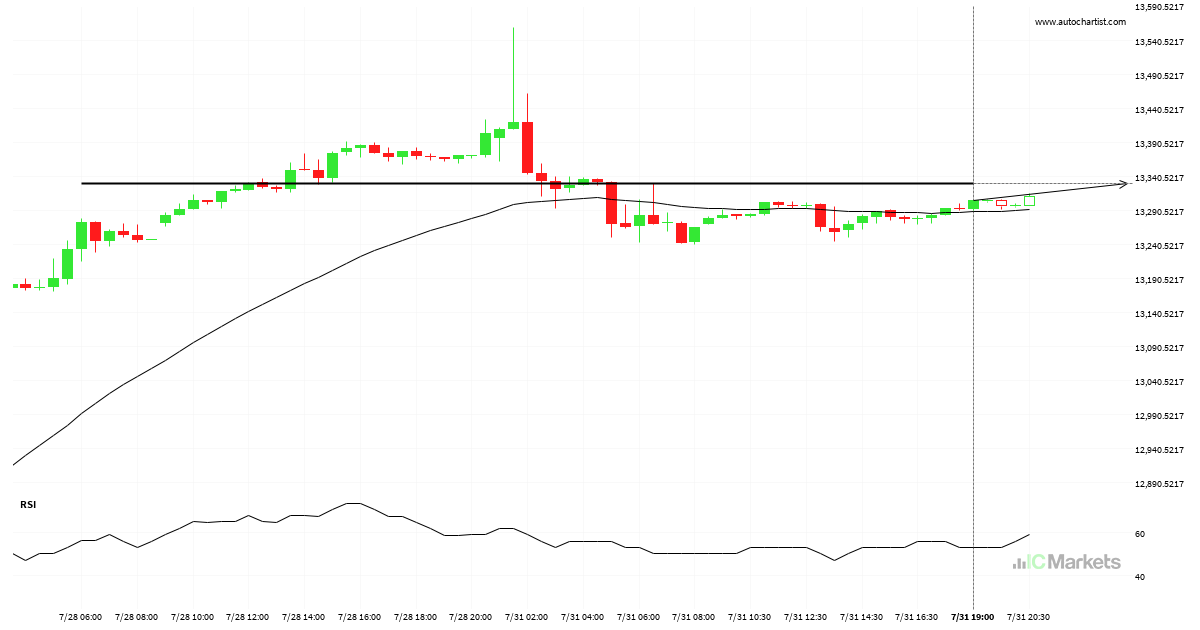
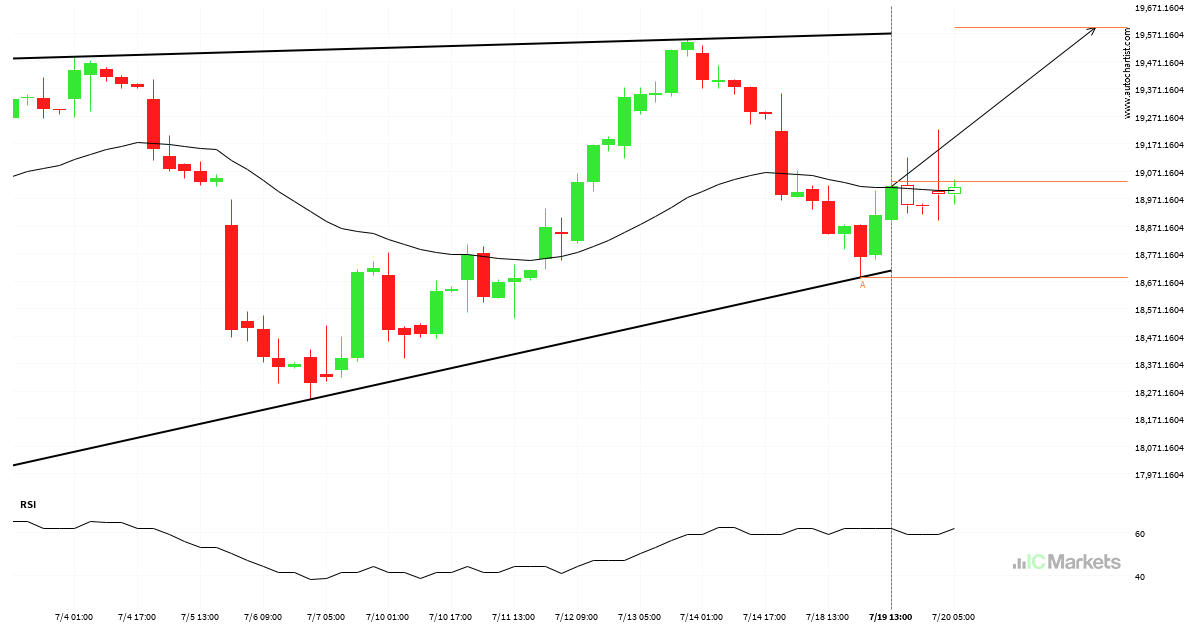
FTSE China A50 Index broke through important 12619.0000 price line

FTSE China A50 Index has broken through a resistance line. It has touched this line numerous times in the last 13 days. This breakout shows a potential move to 12766.1221 within the next 2 days. Because we have seen it retrace from this level in the past, one should wait for confirmation of the breakout.

Read more
July 24, 2023Australian_Stocks_enIC Markets

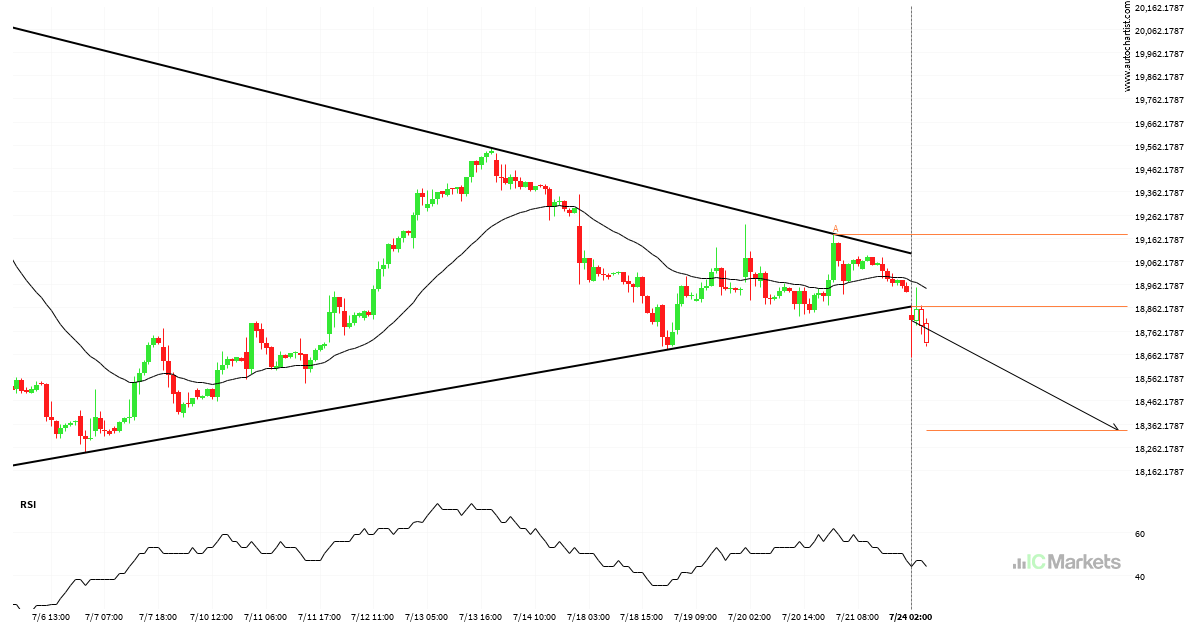
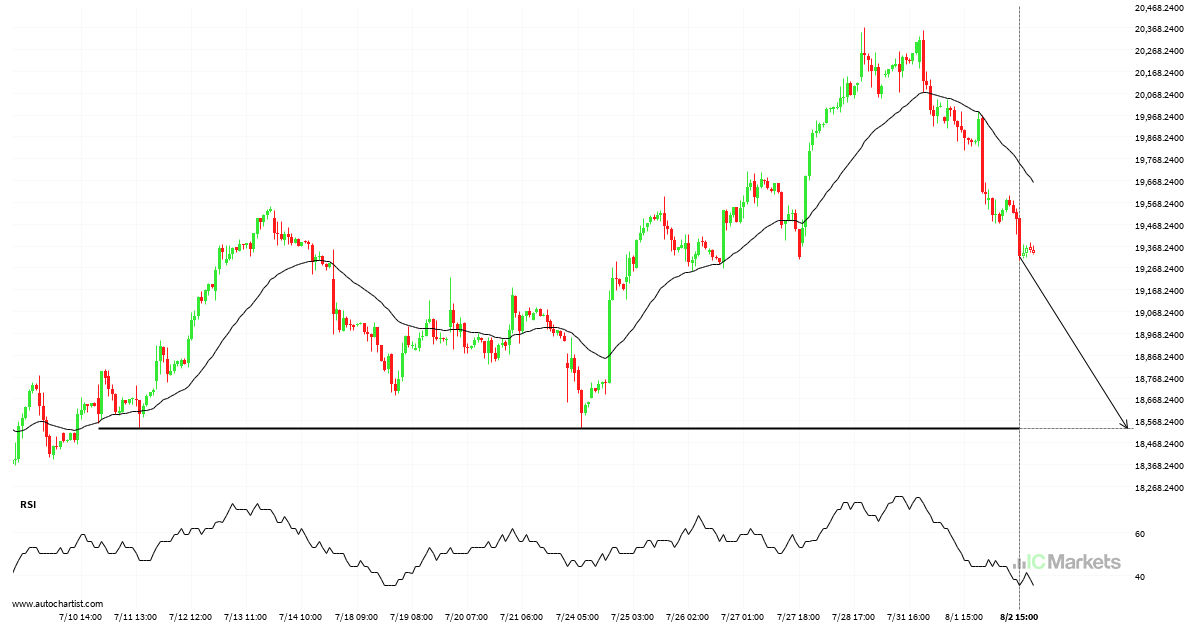
Hong Kong 50 Index has broken through support

Hong Kong 50 Index has broken through a support line. It has touched this line at least twice in the last 21 days. This breakout may indicate a potential move to 18334.4733 within the next 3 days. Because we have seen it retrace from this position in the past, one should wait for confirmation of […]

Read more
July 23, 2023Australian_Stocks_enIC Markets

Australia 200 Index approaching resistance of a Flag

Australia 200 Index is approaching the resistance line of a Flag. It has touched this line numerous times in the last 12 days. If it tests this line again, it should do so in the next 21 hours.

Read more
July 20, 2023Australian_Stocks_enIC Markets

Hong Kong 50 Index approaching resistance of a Ascending Triangle

Hong Kong 50 Index is approaching the resistance line of a Ascending Triangle. It has touched this line numerous times in the last 21 days. If it tests this line again, it should do so in the next 3 days.

Read more
  • 1
  • 2
  • 3
  • …
  • 33
  • 34
  • 35
  • 36
  • 37
  • 38
  • 39
  • …
  • 153
  • 154
  • 155

Recent Posts

  • Brent Oil vs US Dollar – نموذج الرسم البياني – قناة صاعدة
  • Brent Oil vs US Dollar – نموذج الرسم البياني – قناة صاعدة
  • Hong Kong 50 Index – نموذج الرسم البياني – مثلث صاعد
  • Hong Kong 50 Index – รูปแบบกราฟ – สามเหลี่ยมขาขึ้น
  • Hong Kong 50 Index – نموذج الرسم البياني – مثلث صاعد

Recent Comments

    Traducción


     Edit Translation

    Opere con un

    líder del mercado en el que puede confiar

    ABRA UNA CUENTA BURSÁTIL PRUEBE UNA DEMO GRATIS

    Trading en Forex

    • Qué es Raw Spread
    • Resumen de cuentas
    • Abre una Cuenta
    • Trader Launch en Web

    Especificaciones de Trading

    • Spreads y Comisiones
    • Rango de Mercados
    • Horas de Trading
    • Depósitos
    • Retiros

    Acerca de IC Markets

    • Help Center
    • Por qué con IC Markets
    • Regulación
    • Documentos Legales
    • Contáctanos


    Forex Trading

    • Accounts Overview
    • Open an Account
    • Launch Web Trader

    Trading Specifications

    • Spreads and Commissions
    • Range of Market
    • Trading Hours
    • Funding
    • Withdrawal

    About IC Markets

    • Chat with a Specialist 24/7
    • Why IC Markets
    • Regulation
    • Legal Documents
    • Contáctanos

    Descargo de responsabilidad: Estos documentos son material de marketing cuyo contenido es publicado solo con propósitos informativos. Este material no contiene y no debe ser considerado un consejo de inversión y recomendaciones, o sugerencias para llevar a cabo otras acciones con los instrumentos financieros. Los widgets integrados pertenecen a sus autores independientes externo, y IC Markets no es responsable de su contenido o cómo afectan en las operaciones.

    Derechos reservados de todo el contenido. Las opiniones de los autores tal vez no coincidan con la opinión de los editores del blog. Cuando copie material de este sitio o conecte RSS para volver a publicar nuestros artículos, es obligatorio el enlace a IC Markets o la atribución en el formato “Blog de IC Market”. Para dudas generales, por favor, póngase en contacto con la oficina editorial a través de la página “Contacto”.

    Advertencia de riesgo: Operar derivados conlleva un altor riesgo en su capital y solo debería operar con capital que puede permitirse perder. Las operaciones con derivados podrían no ser adecuadas para todos los inversores, por lo tanto, asegúrese de entender por completo los riesgos que conlleva y buscar asesoramiento independiente si fuera necesario. Una Declaración de Divulgación del Producto (PDS, por sus siglas en inglés) se tendrá en cuenta antes de participar en una transacción con nosotros.

    Los contenidos de esta página son solo información general y no tienen en cuenta su situación personal, objetivos financieros o necesidades. Depende de usted garantizar que los productos que ofrecemos se ajustas a sus necesidades específicas. No debería operar con nosotros a menos que entienda las características y riesgos de los productos que ofrecemos. Esto significa que tal vez necesite buscar asesoramiento independiente antes de empezar a operar con nosotros.

    © 2022 Raw Trading Ltd | All rights reserved.
    • Sample Page